
Inventory turnover ratio measures how many times a business sells and replaces its stock during a given period. The formula is cost of goods sold (COGS) divided by average inventory, and it uses COGS rather than sales because COGS reflects what the inventory actually cost you, not what you sold it for with markup added.
A high ratio usually means strong sales or lean, efficient purchasing. A low ratio usually means cash is sitting on a shelf, tied up in stock that isn’t moving.
Here’s the quick version: if your COGS for the year is $500,000 and your average inventory is $100,000, your turnover ratio is 5. That means you sold and replenished your entire inventory five times over the year. Whether that’s good depends on your industry, but for most small retailers, a moderate inventory turnover ratio is generally recommended.
- Formula: Inventory Turnover = COGS ÷ Average Inventory
- High ratio: fast-moving stock, efficient cash use, but watch for stockout risk
- Low ratio: overstocking, aging inventory, cash stuck in the warehouse
Key Takeaways
Inventory turnover ratio equals COGS divided by average inventory, and pairing it with DSI and supplier lead-time data gives the clearest read on whether your stock strategy is actually working.
| Point | Details |
|---|---|
| Core formula | Inventory Turnover = COGS ÷ Average Inventory; use COGS, never sales revenue. |
| Convert to days | DSI = 365 ÷ turnover; a ratio of 4 equals roughly 91 days of stock on hand. |
| Benchmark by industry | Compare your ratio to your own trend and industry-specific ranges, not a generic average. |
| Watch for distortions | Seasonality, valuation method, and misclassified inventory can all skew the ratio. |
| Fix lead time first | Shorter, more reliable inbound shipping often improves turns faster than reorder tweaks. |
What Is Inventory Turnover Ratio and Why Does It Matter?
Inventory turnover ratio tells you how efficiently your stock converts into revenue. It counts the number of full inventory cycles, sold and restocked, within a set window, usually a year, a quarter, or (for fast movers) a month.
For a small or mid-sized business, this number carries more weight than most owners realize. Every dollar sitting in unsold inventory is a dollar that isn’t funding payroll, marketing, or your next purchase order. Warehousing costs, insurance, and the risk of products going stale or out of season all climb the longer stock sits still.
- Cash flow: slow turns mean capital is locked up instead of circulating
- Carrying cost: rent, insurance, and handling fees pile up on stagnant SKUs
- Shelf life and obsolescence: seasonal or trend-based goods lose value fast if they don’t move
- Customer experience: too little turnover often pairs with too much dead stock, while too much turnover can mean empty shelves and missed sales
How Do You Calculate Inventory Turnover?
The formula itself is simple: Inventory Turnover = COGS ÷ Average Inventory. The hard part is knowing exactly what numbers to plug in.
- Find your COGS. This lives on your income statement, and it’s the direct cost of producing or acquiring what you sold. COGS is used instead of sales revenue because sales includes your markup, which would inflate the ratio and misrepresent how efficiently you’re actually moving product.
- Calculate average inventory. The standard method adds beginning and ending inventory for the period, then divides by two. It’s quick, but it can distort results for businesses with big seasonal swings.
- Consider a monthly average for seasonal businesses. Averaging inventory across twelve monthly snapshots, or using a rolling twelve-month average, gives a far more accurate picture than a simple beginning-to-ending calculation when your stock levels spike around holidays or a launch window.
- Know the acceptable shortcuts. If monthly figures aren’t available, using ending inventory alone is common but less precise. A sales-based variant (using revenue instead of COGS) shows up occasionally, but it’s not recommended since it skews the ratio upward.
Pro Tip: If your business has a strong peak season, like Q4 holiday sales, never calculate turnover using a single snapshot taken right after your busiest month. You’ll get an artificially low average inventory and an inflated ratio that doesn’t reflect how your business runs the other eleven months.
Worked Examples: Retail and Manufacturing
Numbers make this concrete. Here are two scenarios you can copy directly for your own books.
Retail example. A home goods shop reports COGS of $720,000 for the year. Beginning inventory was $150,000, and ending inventory was $170,000.
- Average inventory = ($150,000 + $170,000) ÷ 2 = $160,000
- Turnover = $720,000 ÷ $160,000 = 4.5
- Interpretation: the shop cycles through its entire stock multiple times a year, which is respectable for general home goods, though a specialty electronics retailer would want a faster pace.
Manufacturing example. A small furniture maker has COGS of $1,200,000, including raw materials and work-in-process. Beginning inventory (raw materials plus WIP plus finished goods) was $400,000, ending inventory was $500,000.
- Average inventory = ($400,000 + $500,000) ÷ 2 = $450,000
- Turnover = $1,200,000 ÷ $450,000 = 2.67
- Interpretation: a turnover under 3 is normal in manufacturing, where raw materials and WIP sit longer than finished retail goods. If this number were dropping year over year, it would be worth checking whether raw material lead times had stretched out.
How Do You Convert Inventory Turns to Days?
Turnover as a raw number is useful, but days on hand is what you actually plan around. The conversion is DSI = 365 ÷ inventory turnover, giving you Days Sales of Inventory, or DSI.
Take the retail example above: a turnover of 4.5 converts to 365 ÷ 4.5, or about 81 days of inventory on hand at any given time. A turnover of 4 converts to roughly 91 days.
- DSI tells you exactly how many days of stock you’re carrying right now
- It’s more actionable than a raw turnover number when you’re setting reorder points
- Pairing DSI with supplier lead time tells you precisely when to trigger your next purchase order before you run dry
What Counts as a Good Inventory Turnover Ratio?
There’s no single number that applies across every business. A grocery chain selling perishables might turn inventory 15 to 20 times a year, while a jewelry retailer might turn it twice. Benchmarks vary so widely by industry that using a generic average is nearly useless; the comparison that matters is against your own sector and your own history.
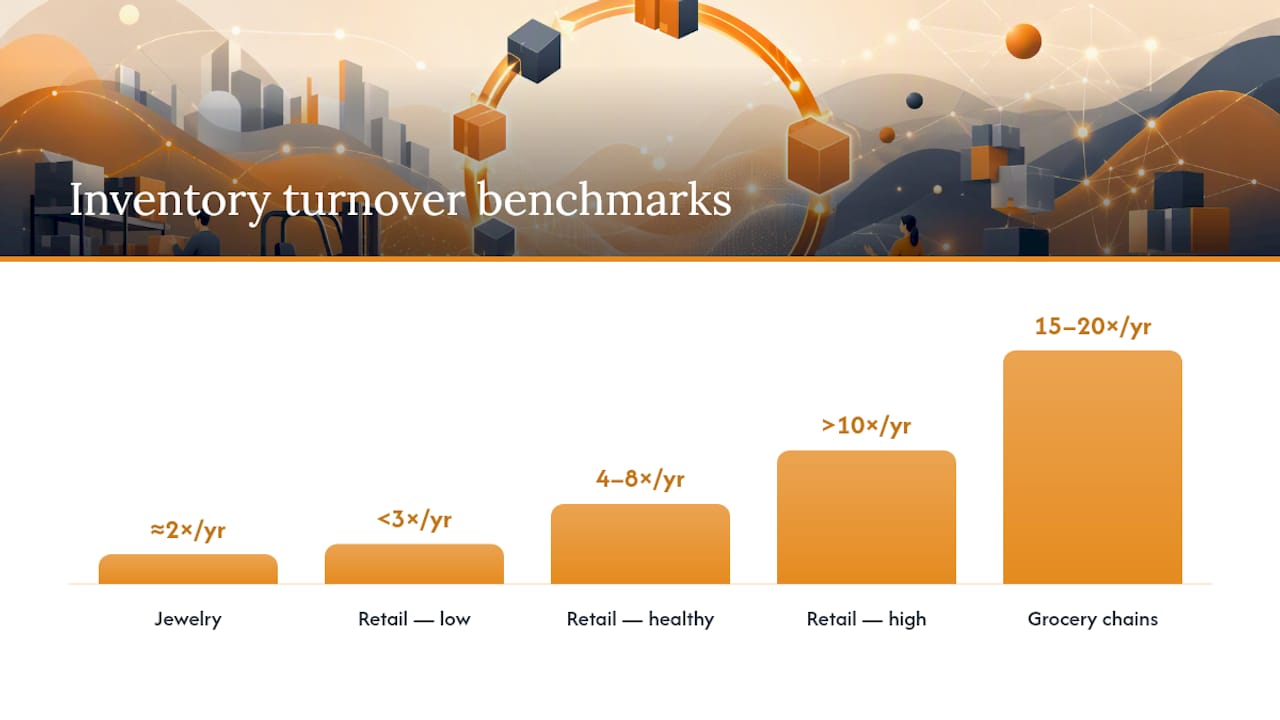
Rough guardrails for general retail and ecommerce: below 3 often signals overstocking or weak demand, 4 to 8 is a healthy working range for most small and mid-sized sellers, and above 10 can mean tight, efficient operations, or it can mean you’re chronically understocked and losing sales to stockouts.
If your ratio suddenly jumps or drops, don’t assume the worst before checking three things: did sales volume genuinely shift, did you switch inventory valuation methods, and did a wave of returns or write-offs distort the ending balance. A ratio taken in isolation, without a trendline or peer comparison, tells you far less than it seems to.
How Can You Improve Inventory Turnover?
Raising your turnover isn’t about slashing stock blindly. It’s about matching supply to actual demand more precisely.
- Sharpen demand forecasting using sales history and seasonality patterns rather than gut instinct
- Shorten supplier lead times so you can order closer to when you actually need stock
- Set just-in-time reorder points tied to real velocity data, not fixed monthly cycles
- Rationalize your SKU list by cutting or bundling chronically slow movers
- Run clearance or dynamic pricing on aging stock before it becomes a total write-off
- Improve warehouse slotting and batch picking so fast movers are easier to ship quickly, reducing handling delays that slow replenishment cycles
Pro Tip: If you’re a small team with limited bandwidth, start with SKU rationalization before touching your reorder system. Cutting the bottom 10% of slow-moving SKUs usually delivers a faster, more visible turnover improvement than rebuilding your entire forecasting process.
What Mistakes Distort the Inventory Turnover Ratio?
The math is simple, but the inputs trip people up constantly.
- Using only end-of-period inventory instead of an average, which can wildly overstate or understate turns depending on timing
- Ignoring seasonality, especially for businesses with a strong Q4 or summer peak, where a single snapshot never represents the full year
- Misclassifying inventory, like counting consigned goods, in-transit shipments, or work-in-process as available stock when they aren’t sellable yet
- Valuation method differences, since LIFO, FIFO, and weighted-average costing each produce different inventory values, making cross-company comparisons unreliable unless you know which method is in use
- Returns, shrinkage, and obsolete stock that inflate your recorded inventory balance without reflecting real sellable value, quietly dragging your ratio in the wrong direction
How Does Logistics Affect Inventory Turnover?
Turnover isn’t just an accounting exercise. It’s downstream of how fast and how reliably your inventory actually arrives.
Longer or inconsistent supplier lead times force you to hold more safety stock, which drags your average inventory up and your turns down. Shorten and stabilize that lead time, and you can run leaner without raising stockout risk.
- Measure your inbound lead-time variance over the last several shipments, not just the average
- Match your reorder cadence to the shipping lane you’re using; air freight allows tighter, more frequent cycles than ocean freight
- Build safety stock buffers around your actual variance, not a flat guess
A seller shipping via slow, unpredictable freight often needs 45 to 60 days of buffer stock just to avoid gaps. Move to faster, more consistent DDP shipping that clears customs and delivers in a single tracked workflow, and that buffer can shrink meaningfully, freeing up cash that was previously locked in safety stock. ForwarderOne’s account managers work with sellers specifically on aligning reorder cycles to shipping lanes for this reason.
Pro Tip: If your DSI keeps climbing even though sales are steady, check your inbound transit reliability before you touch your reorder quantities. A logistics problem disguised as a demand problem is one of the most common, and most fixable, drivers of poor turns.

A Practical Note on Using This Metric
Inventory turnover only tells half the story on its own. I’ve found it’s most useful paired with fill rate and supplier lead time, since a ratio can look healthy while stockouts are quietly costing you sales. Track all three together, and check them against your outsourced logistics or 3PL warehousing arrangements if you use one.
Frequently Asked Questions
What is inventory turnover ratio in simple terms? It’s a measure of how many times your business sells through and replaces its stock in a given period, calculated as COGS divided by average inventory.
What is a good inventory turnover ratio for a small business? Most small retailers and ecommerce sellers land between 4 and 8 turns a year, though the right number depends heavily on your product category and sales cycle.
How do you calculate average inventory? Add beginning and ending inventory for the period and divide by two. For seasonal businesses, a monthly or rolling twelve-month average is more accurate.
Why use COGS instead of sales in the formula? Sales includes markup, which inflates the ratio and misrepresents how efficiently inventory is actually moving. COGS reflects the true cost basis of the stock sold.
Can inventory turnover be too high? Yes. An unusually high ratio can mean you’re running too lean and risking stockouts, which costs you sales and can damage customer trust over time.
This article is general information, not a substitute for advice from a qualified financial advisor. Consult a qualified financial professional about your own circumstances before acting on anything here.
ForwarderOne connects inventory turns to freight planning
Inventory targets only work when inbound freight is predictable. ForwarderOne helps Amazon and ecommerce sellers plan China-to-U.S. DDP shipments around reorder points, customs timing, FBA delivery windows, and warehouse capacity so inventory days do not drift because cargo is stuck between supplier pickup and final delivery.
Use this ratio alongside your lead-time variance, safety stock, and landed-cost model. If your turns are healthy but stockouts are frequent, the answer may be a steadier replenishment cadence rather than a smaller purchase order. If your turns are weak, better consolidation and clearer delivery milestones can show which SKUs are actually slow and which ones are delayed by the route.
Need a steadier replenishment plan?
ForwarderOne coordinates supplier pickup, DDP customs clearance, duty payment, FBA prep details, and final delivery so your inventory plan reflects real freight timing.