The carbon footprint of shipping is the total greenhouse-gas emissions, measured in CO2e, produced to move goods across transport legs — from fuel burned on ships, trucks, planes, and trains to upstream fuel production — expressed per shipment or per tonne-kilometer. The IMO, the GLEC Framework, and the GHG Protocol all use CO2e as the standard unit because it captures not just carbon dioxide but also methane and nitrous oxide from combustion and fuel production. A Science Advances study estimated that international trade-linked transportation emitted a large amount of CO2 in 2021, with ocean shipping responsible for the largest single share. One thing worth flagging early: a 1-lb parcel and a full container load are measured differently. Parcels are typically quoted in kg CO2e per shipment, while bulk and containerized freight use tonne-km or TEU-km as the activity unit. Mixing those units is one of the most common mistakes in carbon accounting.
Key Takeaways
The single most effective way to reduce your shipping carbon footprint is to shift from air to ocean freight and maximize container utilization — those two choices cut actual emissions, not just accounting entries.
| Point | Details |
|---|---|
| CO2e is the standard unit | All shipping emissions, including upstream fuel production, should be expressed in kg CO2e using WTW factors for accurate comparison. |
| Mode choice dominates | Air freight emits roughly 500–800 g CO2e per tonne-km versus 10–20 g for ocean containers — a difference of 40–70x on the same route. |
| Verify offset quality | Credible offsets require additionality, permanence, and third-party verification; prioritize real emission cuts before purchasing any offset. |
| Use GLEC or EPA factors | The GLEC Framework and U.S. EPA emission factors are the standard references for freight carbon calculations across all modes. |
| ForwarderOne supports lower-carbon routing | ForwarderOne’s consolidation, DDP ocean service, and route planning help Amazon sellers reduce air shipments and improve container fill on China-to-U.S. lanes. |
How the carbon footprint of shipping is measured
The math looks simple: emissions equal activity multiplied by an intensity factor. The tricky part is choosing the right activity unit and the right boundary.
Activity units. For containerized ocean cargo, the standard unit is TEU-km (twenty-foot equivalent unit times kilometers traveled). For bulk carriers, tankers, and roll-on/roll-off vessels, it is tonne-km (cargo weight in metric tonnes times distance). You cannot add TEU-km and tonne-km together — they are incompatible. What you can add is the final result: kg CO2e. Once each leg is converted to emissions, the numbers are unit-agnostic and can be summed across modes.
Accounting boundary. Well-to-wheel (WTW) accounting covers the full fuel lifecycle: extraction, refining, transport, and combustion. Tank-to-wheel (TTW) covers only the combustion step. WTW numbers run roughly 15–25% higher for conventional marine fuel oil, and the GLEC Framework recommends WTW as the default for freight carbon accounting. Under the GHG Protocol, freight you pay for falls under Scope 3, Category 4 (upstream transportation and distribution) if you are the buyer, or Category 9 (downstream transportation) if you are the seller arranging delivery to a customer.
Emission factors. The GLEC Framework publishes mode-specific, fuel-specific intensity values. The U.S. EPA emission factors document provides reference values for road and rail legs commonly used in U.S. reporting. For ocean shipping, AIS-based inventories like SEIM can resolve emissions at the vessel and route level, but they require significant data processing and are better suited to enterprise-scale inventory work than to a quick per-shipment estimate.
Representative intensity ranges by mode (WTW, approximate):
Ranges reflect vessel/vehicle size, load factor, and fuel type. Source: GLEC Framework / Greencalculus.
Common measurement pitfalls:
- Mixing TEU-km and tonne-km activity figures before converting to CO2e
- Using TTW factors when WTW is required by your reporting standard
- Applying average load factors to a specific shipment without adjusting for actual fill rate
- Double-counting emissions when both shipper and carrier report the same leg
- Ignoring upstream fuel production, which can add 15–25% to the combustion-only figure
Pro Tip: When comparing carrier quotes that include a carbon figure, always ask whether the number is WTW or TTW and what load factor was assumed.
How large shipping’s emissions are and what is driving them up
The Science Advances model put trade-linked transportation at 971 Mt CO2 in 2021, with shipping dominating the total across most major trade pairs.
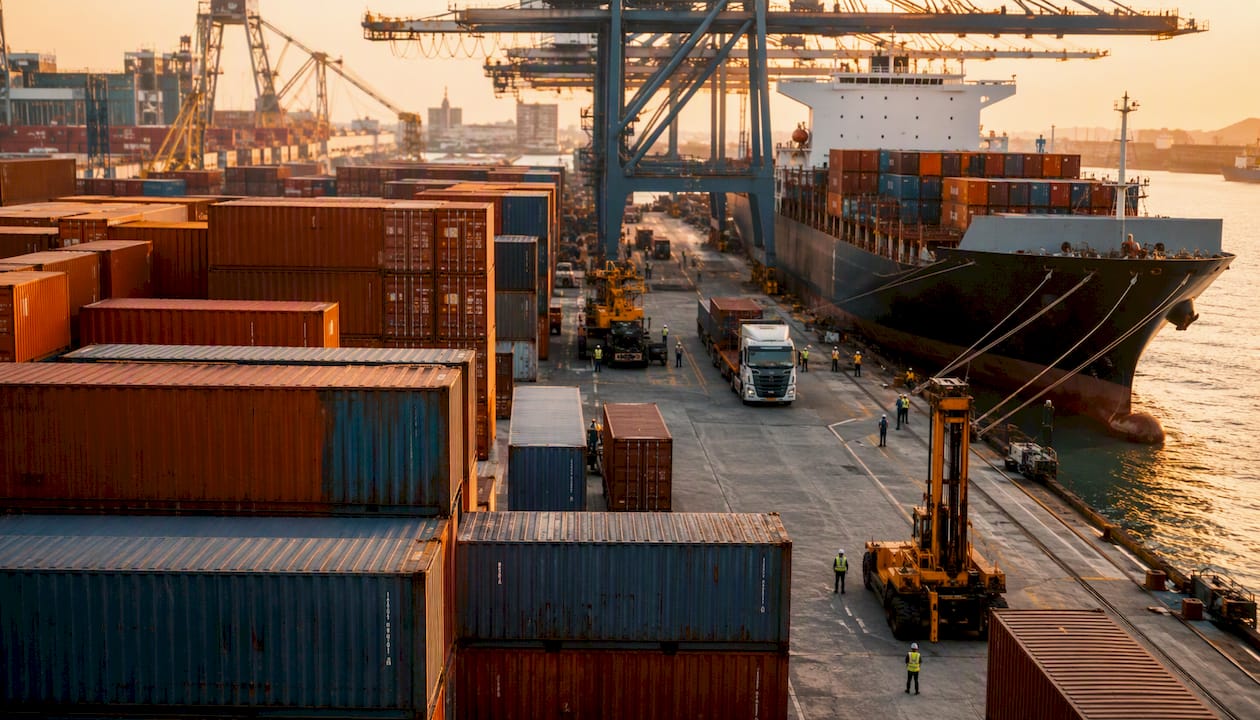
OECD analysis found that global maritime CO2 emissions rose notably between 2019 and 2024. GDP growth and rising transport intensity drove most of that increase, while fuel-intensity improvements partially offset it. The takeaway for businesses: efficiency gains at the vessel level are real but insufficient on their own. Demand-side choices — how much you ship, by which mode, and how full the container is — matter just as much.
The ICCT’s review of 2016–2023 shipping emissions reinforces that point, showing that regulatory pressure from updated IMO measures is beginning to influence fleet behavior, but the trajectory still depends heavily on trade volumes. Transport & Environment tracks the policy side of this closely and is a useful reference for anyone following EU or international shipping regulation.
Key regulatory and trend milestones:
- 2018: IMO adopts its initial GHG strategy, targeting a 50% reduction in total shipping emissions by 2050 versus 2008 levels
- January 2023: EEXI (Energy Efficiency Existing Ship Index) and CII (Carbon Intensity Indicator) ratings become mandatory for vessels above 400 gross tonnes
- 2023: IMO revises its strategy to target net-zero GHG from international shipping by or around mid-century, with indicative checkpoints for 2030 and 2040
- 2024: OECD data confirms maritime emissions continued rising post-pandemic, driven by trade recovery and container demand
The EEXI sets a one-time technical efficiency standard for existing ships. The CII is an annual operational rating that scores vessels A through E — and ships rated D or E for three consecutive years face corrective action plans. For shippers, a carrier’s CII rating is a useful proxy for how efficiently their fleet is actually operating.
What does a real shipment’s carbon footprint look like?
Worked examples make the numbers concrete. The formula is: mass (or TEU count) × distance (km) × mode intensity (g CO2e per unit-km) ÷ 1,000 = kg CO2e.
For multi-leg shipments, calculate each leg separately, then sum the kg CO2e totals.
Example scenarios (WTW, approximate GLEC factors):
| Scenario | Activity | Distance | Intensity | Result |
|---|---|---|---|---|
| Ground parcel, 0.5 kg, 200 km road | 0.0005 tonne-km × 200 | 200 km | 90 g CO2e/tonne-km | ~0.009 kg CO2e |
| Air parcel, 0.5 kg, 6,000 km | 0.0005 tonne × 6,000 km | 6,000 km | 600 g CO2e/tonne-km | ~1.8 kg CO2e |
| Ocean container, 1 TEU, 10,500 km (Pacific) | 1 TEU × 10,500 km | 10,500 km | 15 g CO2e/TEU-km | ~158 kg CO2e |
| 1-tonne pallet, ocean bulk, 10,500 km | 1 tonne × 10,500 km | 10,500 km | 10 g CO2e/tonne-km | ~80 kg CO2e |
The air-versus-ocean contrast is the most striking. A single half-kilogram parcel flown across the Pacific generates roughly 70 times more CO2e than the same parcel’s share of an ocean container on the same route. That ratio is why the mode choice is the single highest-leverage decision in freight carbon management.
Step-by-step for a two-leg China-to-U.S. shipment:
- Leg 1: Truck pickup, 200 km, 500 kg cargo (0.5 tonne × 200 km × 90 g/tonne-km = 9 kg CO2e)
- Leg 2: Ocean container, Shanghai to Los Angeles, 10,500 km, 1 TEU (1 × 10,500 × 15 g/TEU-km = 157.5 kg CO2e)
- Leg 3: Drayage to FBA warehouse, 80 km, 0.5 tonne (0.5 × 80 × 90 = 3.6 kg CO2e)
- Total: 9 + 157.5 + 3.6 = 170.1 kg CO2e
For a detailed breakdown of ocean versus air tradeoffs — including cost and transit time alongside carbon — that comparison is worth reading before you commit to a routing strategy.
Why “carbon-neutral shipping” claims deserve scrutiny
“Carbon neutral” in shipping typically means a carrier has calculated its emissions and purchased offsets to balance them. The reduction itself may be zero. That distinction matters because offsets vary enormously in quality, and the term “carbon neutral” carries no universal legal definition in the U.S.
The Oxford Offsetting Principles from the Smith School set out the criteria that make an offset credible: additionality (the emission reduction would not have happened without the offset purchase), permanence (the carbon stays stored), no double counting, and independent verification. Many offset projects sold to logistics providers fall short on at least one of these.
Common offset quality problems in shipping:
- Additionality failures: Projects that would have happened anyway (e.g., protecting a forest that was never at risk)
- Permanence risk: Forestry offsets that can be reversed by fire, disease, or land-use change
- Leakage: Protecting one area while deforestation shifts to an adjacent one
- Unverified claims: Offsets without third-party certification from Gold Standard, Verra (VCS), or an equivalent body
- Boundary mismatch: A carrier offsets only TTW emissions while marketing the service as “carbon neutral” on a WTW basis
What to ask a carrier or vendor before accepting a carbon-neutral claim:
- What standard certifies the offsets (Gold Standard, VCS, other)?
- Are reductions happening first, with offsets covering only the residual?
- Is the accounting WTW or TTW?
- Is there third-party verification of the emission calculation itself?
- What is the carrier’s CII rating, and what is their fuel-switching roadmap?
Pro Tip: For small and mid-sized shippers, the highest-return move is not buying offsets — it is consolidating shipments, maximizing container fill, and choosing sea over air wherever lead times allow. Those actions cut actual emissions. Offsets are a last resort for residual tons that cannot yet be eliminated.
Concrete ways to reduce your shipping emissions
Reducing the carbon footprint of freight comes down to three levers: mode, load, and planning. The order matters. Mode shift (sea instead of air) delivers the largest per-unit reduction. Load optimization (fuller containers, consolidated shipments) reduces the emissions allocated to your cargo. Planning (longer lead times, better inventory management) is what makes the first two possible.
Operational actions:
- Shift from air to ocean freight wherever a 20–40 day lead time is acceptable
- Consolidate LCL (less-than-container-load) shipments into FCL (full container loads) to reduce per-unit emissions
- Use rail for inland legs where available — diesel rail runs at roughly one-third the intensity of road trucking
- Avoid last-minute air shipments by building safety stock and aligning reorder points with sea-freight lead times
Procurement levers when working with a forwarder or carrier:
- Ask for the carrier’s CII rating and EEXI compliance status
- Specify preference for newer, larger vessels on long ocean legs (larger vessels have lower per-TEU intensity)
- Request AIS-based emissions reporting rather than fleet-average estimates
- Negotiate for WTW accounting in your emissions reports, not TTW
- Ask whether the forwarder can consolidate your cargo with other shippers on the same lane
Service-level documentation to request:
- Shipment-level emission reports with mode, vessel class, distance, and load factor stated
- Upstream fuel emission factors used (WTW multiplier)
- Reporting cadence (monthly or per-shipment)
- Third-party verification or alignment with GLEC Framework methodology
Checklist for your next forwarder conversation:
- What emission factor set do you use (GLEC, EPA, carrier-reported)?
- Do you report WTW or TTW?
- Can you provide per-shipment CO2e figures, not just annual totals?
- What is your process for verifying load factors?
- Can you consolidate my cargo to improve container utilization?
Pro Tip: Amazon sellers shipping from China can cut their carbon footprint significantly by planning inventory 60–90 days ahead and committing to ocean freight as the default mode. A freight forwarder that specializes in FBA shipments can help you build that cadence into your reorder workflow, reducing both emissions and per-unit shipping costs.
Standards, regulations, and tools for measuring shipping emissions
Knowing which framework to use — and when — saves time and prevents reporting errors.
IMO (International Maritime Organization). The IMO sets the international regulatory floor for ship emissions. Its 2023 revised strategy targets net-zero GHG from international shipping by or around mid-century. The EEXI and CII measures, mandatory since January 2023, give shippers a way to assess carrier efficiency: ask for a vessel’s CII rating before booking a long-haul lane.
GLEC Framework (Smart Freight Centre). The Global Logistics Emissions Council Framework is the most widely used methodology for calculating freight transport emissions across all modes. It defines which activity units to use, which intensity factors to apply, and how to handle multi-modal chains. Most reputable freight carbon calculators are built on GLEC logic.
GHG Protocol Scope 3 Standard. For companies reporting corporate emissions, freight falls under Scope 3. Category 4 covers transportation and distribution in your upstream supply chain (goods you buy); Category 9 covers downstream distribution (goods you sell and ship to customers). The GHG Protocol guidance specifies how to allocate emissions across shared transport legs.
U.S. EPA emission factors. The EPA’s emission factors document provides reference values for road and rail modes widely used in U.S. domestic reporting and multimodal chain calculations. It is the standard reference for any U.S.-based Scope 3 inventory that includes trucking or rail legs.
Transport & Environment (T&E). T&E is the leading European advocacy and research organization tracking shipping decarbonization policy. Its shipping climate impact pages are useful for understanding where regulation is heading and for context on fleet-level fuel switching.
ICCT. The International Council on Clean Transportation publishes detailed shipping GHG and air pollution trend data, including analysis of how IMO regulations are affecting fleet behavior. Useful for benchmarking and policy context.
Practical tools for freight carbon calculation:
- Greencalculus freight calculators (road, sea, rail, air): built on GLEC factors; requires mass or TEU count, distance, and mode. Good for quick per-lane estimates.
- Smart Freight Centre’s GLEC Tool: the reference implementation of the GLEC Framework; suited for multi-modal chains and carrier-level reporting.
- AIS-based inventories (SEIM/STEAM): high spatial and temporal resolution; requires significant data processing. Best for ports, large shippers, or enterprise sustainability teams.
- EPA’s SmartWay program: U.S.-focused carrier efficiency rating and reporting tool; useful for domestic road and rail legs and for verifying carrier performance.
The GLEC Framework’s core principle is that emissions from freight transport should be calculated as activity × intensity, where activity is measured in tonne-km or TEU-km and intensity is a mode-and-fuel-specific well-to-wheel factor. This approach makes results comparable across carriers, modes, and reporting periods — which is why it has become the de facto standard for corporate Scope 3 freight accounting.
How to estimate a shipment’s carbon footprint in five steps
This method works for a single parcel, a container load, or a multi-leg supply chain. The inputs are straightforward; the discipline is in keeping the boundary consistent.
-
Define the boundary and the payer. Decide whether you are reporting Scope 3 Category 4 (you bought the freight) or Category 9 (you sold and shipped to a customer). This determines which legs to include and how to allocate shared transport.
-
Choose the right activity unit. Use TEU-km for containerized ocean cargo. Use tonne-km for road, rail, air, bulk ocean, and any leg where cargo is measured by weight. Never mix the two before converting to CO2e.
-
Select mode and fuel intensity factors. Use GLEC Framework WTW factors as your default. For U.S. road and rail legs, the EPA emission factors document is an acceptable reference. If your carrier provides vessel-class-specific factors, use those in preference to fleet averages.
-
Calculate per leg, then sum. Multiply activity by intensity for each leg to get kg CO2e. Add the leg totals. Do not add activity figures across modes.
-
Document your assumptions. Record the load factor used, whether the factor is WTW or TTW, the distance source (port-to-port great circle, actual route, or carrier-reported), and the factor version. This documentation is what makes your estimate auditable and comparable year over year.
Required inputs and where to find them:
- Cargo weight (kg or tonnes): your purchase order or packing list
- TEU count: your booking confirmation
- Route distance: port-to-port calculators (e.g., Sea-Distances.org for ocean legs) or carrier lane data
- Vessel class or carrier lane factor: ask your forwarder or use GLEC default by vessel size category
- Fuel type: carrier reporting or GLEC default (HFO for most deep-sea vessels)
Common mistakes to avoid:
- Converting TEU-km to tonne-km using an assumed cargo weight (this introduces large errors; keep the units separate)
- Using great-circle distance for road legs (actual road distance runs 10–20% longer)
- Applying a 100% load factor when actual utilization is 60–70%
- Forgetting the drayage legs at origin and destination, which can add 5–15% to a container shipment’s total
The tradeoff between accuracy and usability in carbon accounting
Shipping carbon accounting sits in an uncomfortable middle ground. The methodology is well-established — GLEC, GHG Protocol, EPA factors — but the input data is often messy, incomplete, or carrier-dependent. That gap between methodological rigor and real-world data quality is where most businesses get stuck.
The pragmatic answer is to match your measurement effort to your emission volume. For high-volume lanes — your main China-to-U.S. ocean container routes — it is worth investing in vessel-class-specific factors, actual route distances, and verified load factors. The accuracy improvement is meaningful, and those lanes are where your reduction levers are anyway. For small, infrequent shipments, GLEC default factors with conservative load assumptions are good enough. Spending three hours refining the carbon estimate for a 10-kg air parcel is not a good use of anyone’s time.
The more important discipline is consistency. A simple, auditable method applied the same way every quarter tells you more about your progress than a sophisticated model that changes its assumptions each time. Start with standardized factors, document everything, and iterate toward AIS-based or carrier-reported data as your volume and reporting maturity justify it.
ForwarderOne’s consolidation and route-planning services for Amazon sellers are directly relevant here — fewer air shipments and better container utilization are the two changes that move the needle fastest, and a forwarder with good lane data can help you model the emissions impact of those choices before you commit.
ForwarderOne cuts your shipping emissions through smarter routing
For Amazon sellers shipping from China to U.S. fulfillment centers, the fastest path to a lower carbon footprint is a forwarder that defaults to ocean consolidation, plans routes to maximize container fill, and gives you the shipment-level data to track progress.
ForwarderOne’s DDP freight forwarding service handles customs, duties, labeling, and delivery in a single workflow — which means fewer fragmented air shipments and more predictable ocean legs. Consolidation across multiple sellers on the same lane improves container utilization, directly reducing the CO2e allocated to your cargo. For sellers ready to move away from reactive air shipments, get a quote from ForwarderOne and see what a planned ocean routing strategy looks like for your lanes.
Need a clearer landed-cost plan?
ForwarderOne coordinates supplier pickup, DDP customs clearance, duty payment, FBA prep details, and final delivery under one shipment plan.