
What is a freight rate benchmark?
A freight rate benchmark is a reference range used to judge whether a quoted shipping rate is fair compared to typical market conditions for a specific lane and shipment type. Freight rate benchmarking involves comparing your actual paid shipping rates against current market rates for identical shipments to evaluate cost competitiveness.
Many logistics teams mistakenly treat the benchmark as a single average number. Rates actually vary across a distribution. A more accurate approach uses a band reflecting lower, median, and upper segments of the market to show variability and context in pricing.
Knowing where your rate falls within that band reveals more than a single average. A rate in the higher part of the market on a frequently shipped lane may indicate a procurement issue, while similar rates on difficult or peak-season lanes may be justifiable.

Benchmark data comes from various sources such as published market indices, peer rate averages from industry networks, historical contract data, and spot rate feeds, although these sources vary in precision and coverage. No single source is complete, so experienced teams cross-reference at least two.
Why benchmarking your freight rates gives you real negotiating power
Freight rate benchmarking does more than confirm whether you are overpaying. It shifts the entire dynamic of carrier negotiations. When you walk into a rate discussion with lane-specific market data, you are no longer asking a carrier what they charge. You are presenting a target rate grounded in what the market actually supports.

That shift matters more than most procurement teams realize. Without benchmark data, negotiations default to the carrier's framing. With it, you set the anchor.
The practical benefits extend well beyond the negotiating table:
- Cost control: Benchmarking surfaces overpayments on specific lanes before they compound across a full contract cycle
- Carrier selection: Knowing market ranges lets you evaluate bids objectively rather than accepting the first reasonable-sounding quote
- Contract timing: Benchmarking mid-cycle can reveal opportunities for renegotiation when market rates have changed significantly, rather than only waiting for contract renewal.
- Procurement credibility: Rate decisions backed by data are easier to defend internally and to carriers
Many shippers miss mid-cycle renegotiation opportunities when benchmarking reveals above-market rates, leaving real savings uncaptured until the next annual cycle. That is a structural problem with how most teams schedule their benchmarking reviews, not a limitation of the tool itself.
Key metrics to track when evaluating freight cost benchmarks
Price is only one dimension of a freight rate benchmark. A rate that looks competitive on paper can still represent poor value if service quality is inconsistent. These are the metrics that give you the full picture:
- Cost per shipment: The total landed cost for a specific lane, including base rate, fuel surcharge, and all accessorial charges. This is your primary benchmarking metric for comparing against market data.
- On-time delivery rate: A carrier quoting below market but delivering late 20% of the time is not a bargain. On-time performance belongs in every benchmark comparison.
- Fuel surcharge: Variable fees like fuel surcharges tend to be uniform across carriers for a given lane, so deviations from the market norm are a red flag worth investigating.
- Accessorial charges: Detention, liftgate, residential delivery, and similar fees vary widely and can erode a competitive base rate quickly. Always benchmark the all-in cost, not just the line-haul.
- Fixed vs. variable cost components: Research published in the International Journal of Logistics Management found that fixed base charges vary by shipper while variable fees like fuel surcharges remain largely uniform. Isolating these components is what makes a benchmark analysis accurate rather than misleading.
Using a range of metrics beyond price alone gives you a more honest read on whether a carrier relationship is actually performing at market level.
How to conduct a freight rate benchmark in practice
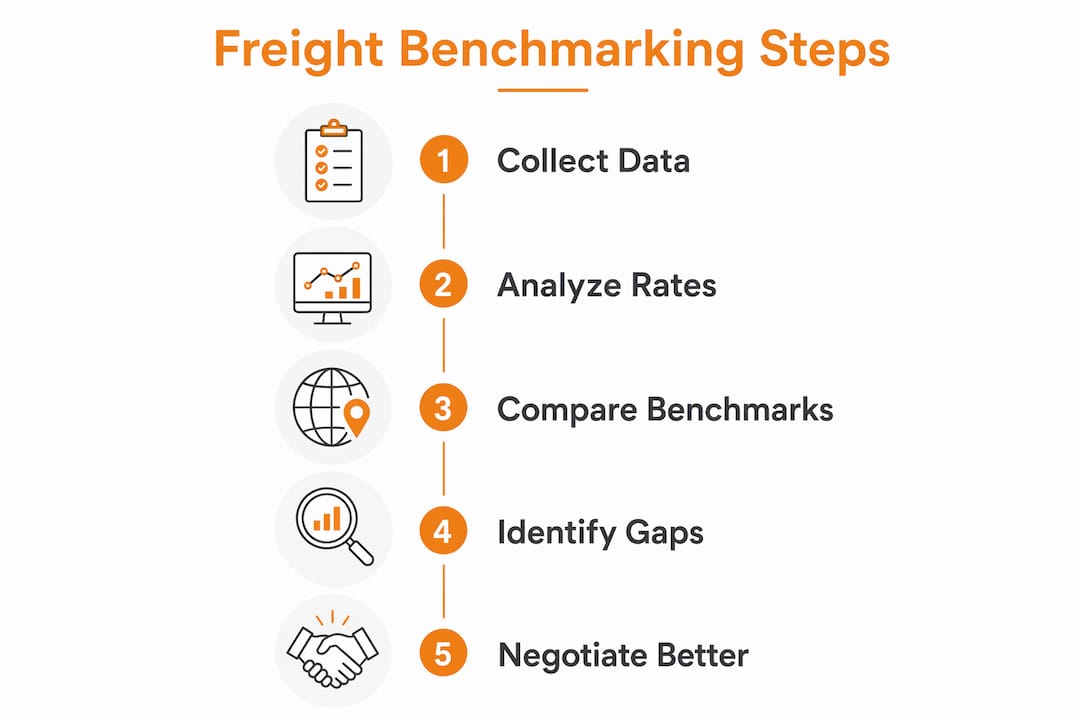
Benchmarking is not a one-time project. Done well, it is a repeatable process with clear steps.
- Collect your rate data. Pull both contract rates and spot rates for the lanes you want to evaluate. Include all cost components: base rate, fuel surcharge, and accessorials. Incomplete data produces incomplete benchmarks.
- Normalize for shipment characteristics. Rates vary by weight, equipment type, distance, and pickup day. Before comparing your rates to market data, normalize for these variables so you are comparing like to like. A flatbed rate cannot benchmark against a dry van rate.
- Source your market data. Freight benchmarking tools combine spot and contract rates with proprietary algorithms to generate real-time market benchmarks for specific lanes and container types. Cross-reference at least two data sources, since sampling windows and normalization methods differ between providers.
- Define your benchmark band. Structure your benchmark around p25, median, and p75 for each lane. This gives you a realistic range rather than a single target that ignores natural market variability.
- Map your rates to the band. Plot each of your contract rates against the benchmark band. Rates above p75 are candidates for renegotiation. Rates below p25 deserve scrutiny too, since they may signal service risk or hidden costs.
- Set a review frequency. Reliable benchmarking requires frequent updates to reflect market dynamics. Quarterly reviews are a reasonable baseline for most shippers; monthly reviews make sense for high-volume lanes or volatile markets.
- Act on mid-cycle findings. If benchmarking reveals that a lane is running above market between contract renewals, that is a trigger for renegotiation, not a note to revisit next year. Carriers are often willing to adjust rates mid-cycle when presented with credible market data.
Understanding the factors driving freight costs on each lane makes step two significantly easier, particularly for international shipments where fuel, port congestion, and currency fluctuations all feed into the rate.
Pro Tip: When benchmarking international lanes, treat ocean freight and domestic drayage as separate benchmarks. Blending them into a single cost-per-shipment figure obscures where the real pricing problem sits.
How to interpret freight rate benchmarks without getting misled
Reading a benchmark correctly is a skill, and the most common error is treating the output as more precise than it actually is. Benchmark ranges account for variability driven by operational factors like pickup day, appointment windows, and detention risk. A quote that looks high against the median may be entirely fair once you factor in a tight delivery window or a shipper location with a history of detention charges.
Carrier reputation and shipper reputation both affect where rates land within the band. A shipper known for quick loading, accurate paperwork, and on-time appointments will attract better rates than one with a reputation for delays. That operational context belongs in your interpretation, not just the numbers.
The other trap is using a single data source as the definitive truth. Using lane-specific data from multiple sources changes negotiations from price queries to market-based contracts, but only when you understand the differences between those sources. Spot rate indices reflect current transactional activity. Contract rate databases reflect negotiated agreements, often with a lag. Neither is wrong; they answer different questions.
Shifting your negotiation approach from "what is your rate?" to "here is the market range for this lane" is the practical payoff of good benchmarking. It moves the conversation onto objective ground. For Amazon sellers and importers managing China-to-US lanes, understanding freight spot rates alongside contract benchmarks gives you the full picture of where your costs stand relative to the market.
Pro Tip: Never use a benchmark from a different season without adjusting for cyclical demand. A Q4 benchmark applied to a Q2 negotiation will skew your target rate in the wrong direction.
Key Takeaways
Freight rate benchmarking gives logistics professionals a structured, data-driven way to evaluate whether their shipping costs are competitive, and to act on that information before the next contract cycle.
| Point | Details |
|---|---|
| Benchmark as a range, not a number | Use p25, median, and p75 to capture market variability on each lane. |
| Isolate fixed and variable costs | Fixed base charges vary by shipper; variable fees like fuel surcharges tend to be uniform, so separate them for accurate analysis. |
| Track more than price | Cost per shipment, on-time delivery rate, fuel surcharge, and accessorial charges together give a complete picture. |
| Review frequently | Quarterly benchmarking at minimum keeps your rates aligned with current market conditions and surfaces mid-cycle renegotiation opportunities. |
| Shift the negotiation frame | Lane-specific market data moves conversations from price requests to target-rate discussions, improving contract outcomes. |
If you ship inventory from China to US fulfillment centers and want rates you can actually benchmark against the market, ForwarderOne's DDP freight services handle customs, duties, and delivery in a single workflow, with over 99% on-time delivery and a dedicated account manager on every shipment.

Need rates you can benchmark lane by lane?
ForwarderOne gives ecommerce sellers transparent DDP freight quotes with the duty, customs, and final delivery work tied to one shipment plan.